
Page Contents
- 1 Location of Olive Groves and/or Processors
- 2 Australian or Foreign Ownership of Australian Olive Businesses
- 3 Tonnes of Olives Produced
- 4 Number of Trees in Respondents Olive Groves
- 5 Olive Oil or Table Olives
- 6 Average age of Australian Olive Trees
- 7 Olive Grove Ownership Duration
- 8 Varietals Planted in Australian Olive Groves
- 9 Unproductive Olive Trees
- 10 Australian Grove Layouts
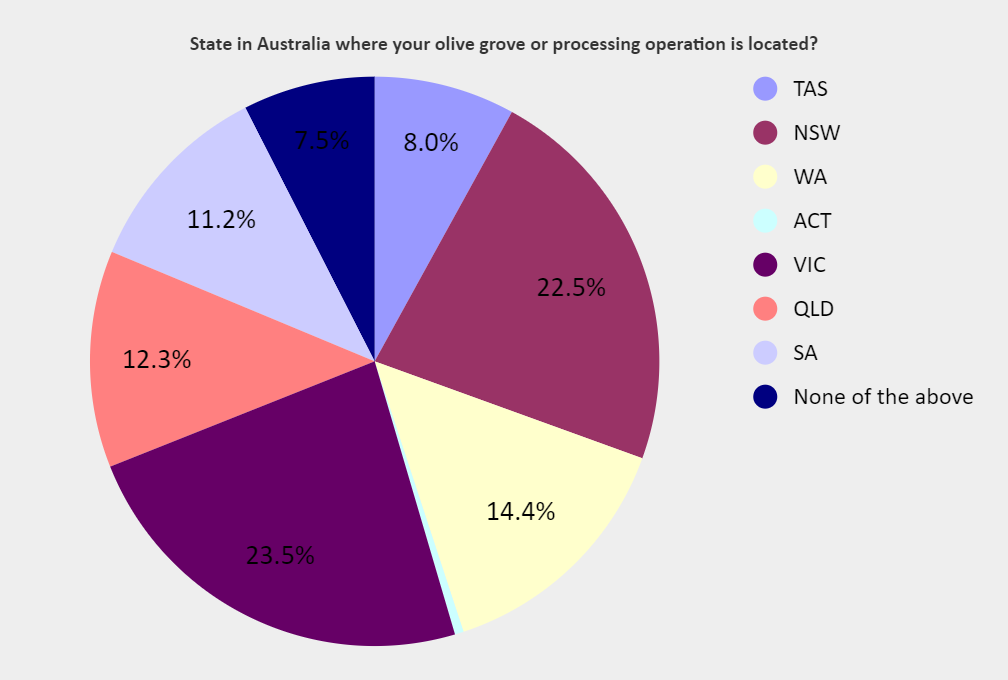
Location of Olive Groves and/or Processors
Victoria and New South Wales showed the highest number of groves located in these areas followed by Western Australia.
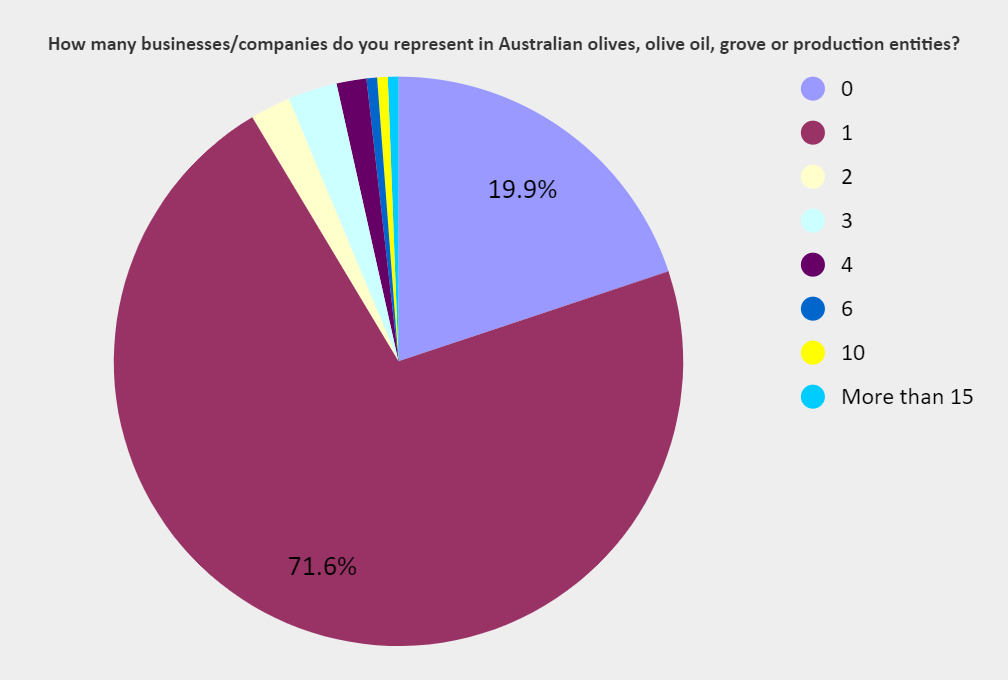
Representatives of Entities in the Industry
71% of respondents are operating one grove or production facility in Australia. There was one respondent who operates more than 15 entities in the Australian Olive Industry.
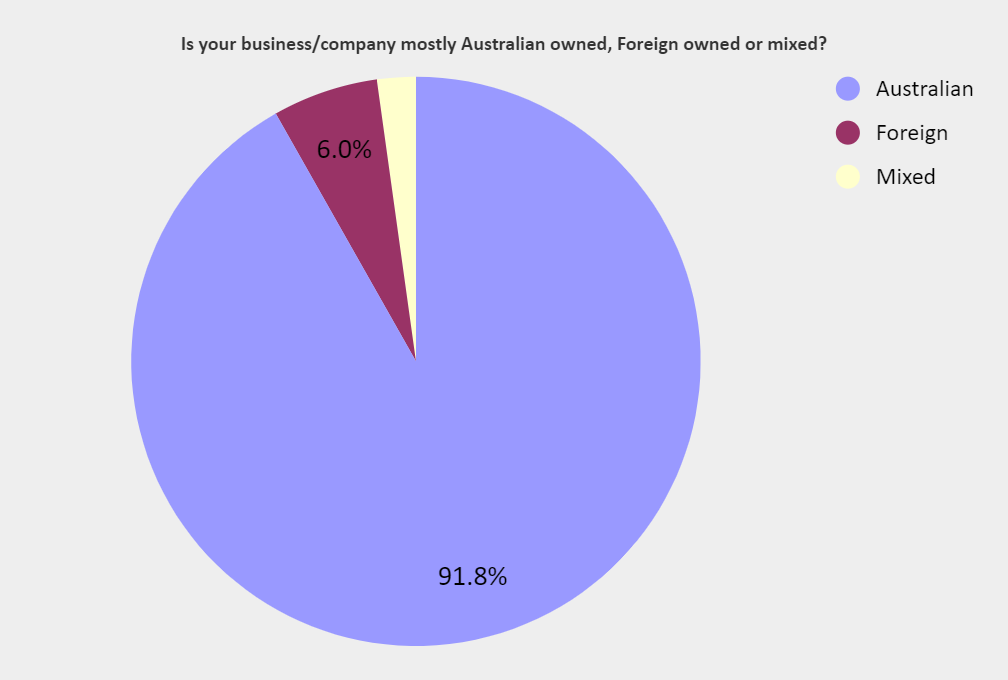
Australian or Foreign Ownership of Australian Olive Businesses
Almost 92% of olive businesses are also Australian owned. 6% of Australian olive groves are Foreign owned and 2.2% had a mix of Australian and Foreign ownership.
Tonnes of Olives Produced
The largest respondent accounted for over 80,000T which was collated with other large enterprise producers as an average over 5 years.
Boundary Bend produces approximately 65% of Australia’s production.
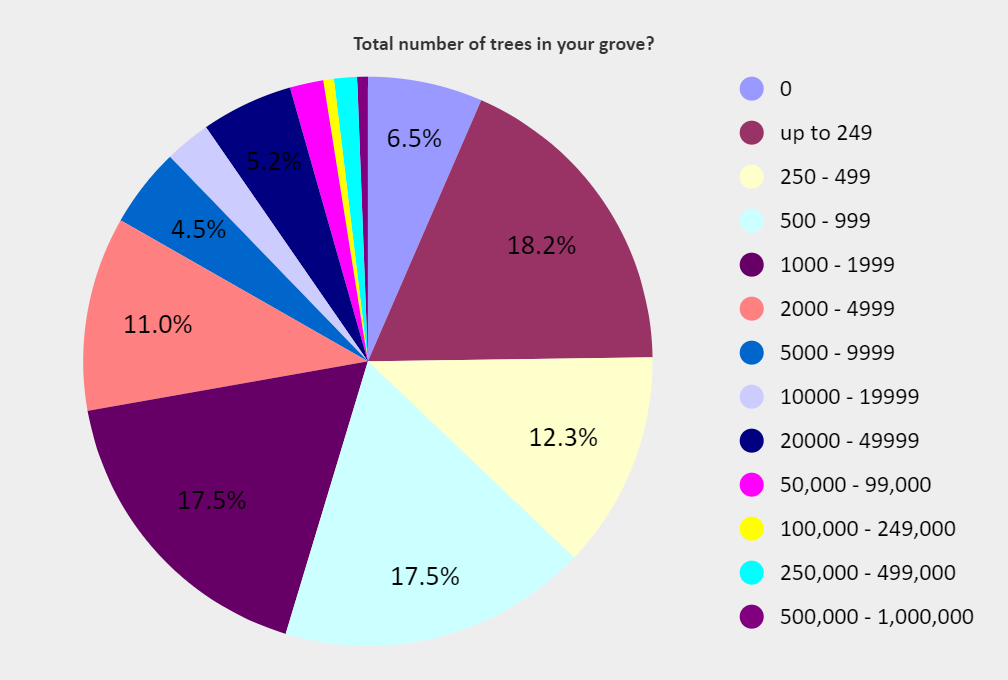
Number of Trees in Respondents Olive Groves
A strong industry response was made from a balance from large, medium, small and artisan producers.
Boundary Bend has a total of 6,433 ha of trees planted which is over 2.6M trees
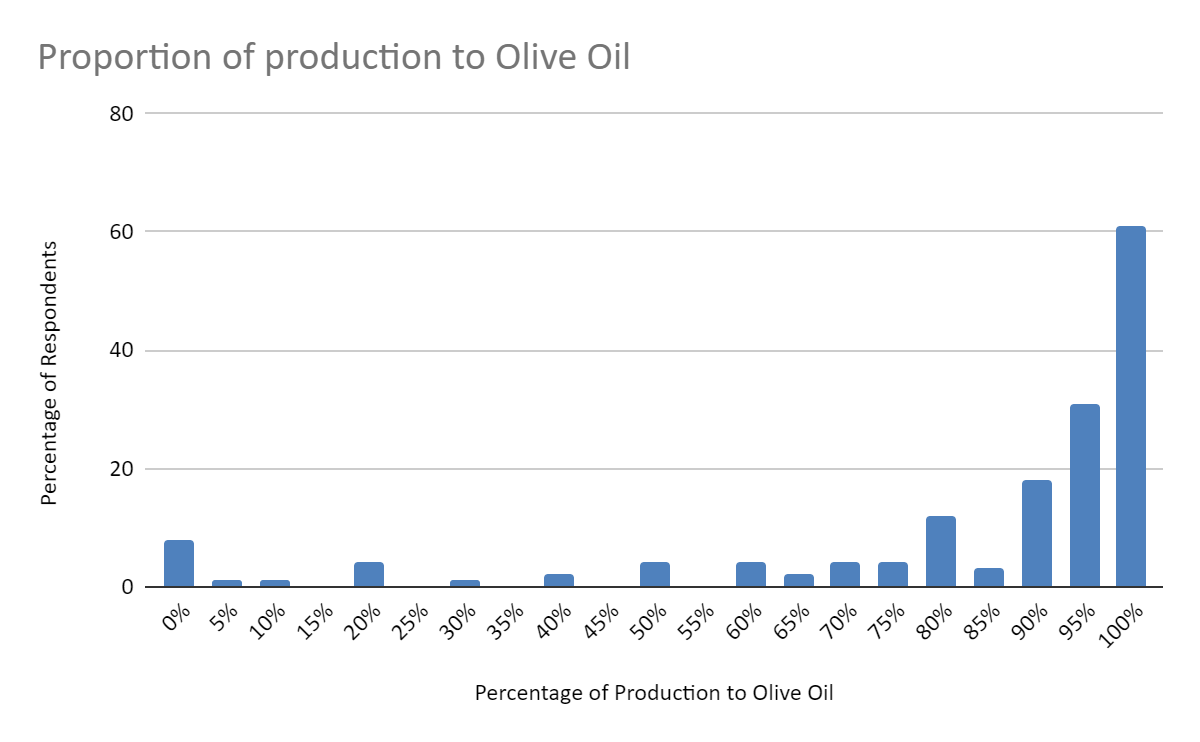
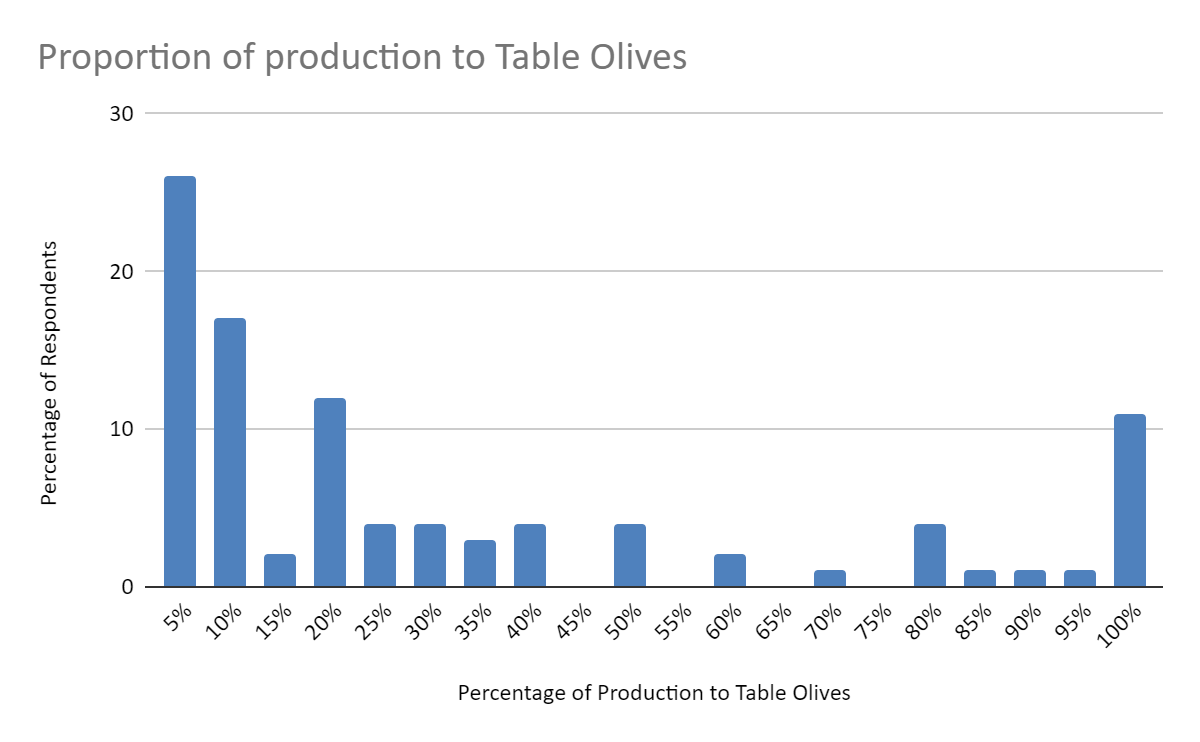
Olive Oil or Table Olives
Respondents indicated how much production in olive oil or table olives came from their olive growing operation. Olive Oil production outweighs Table Olive production in Australia.
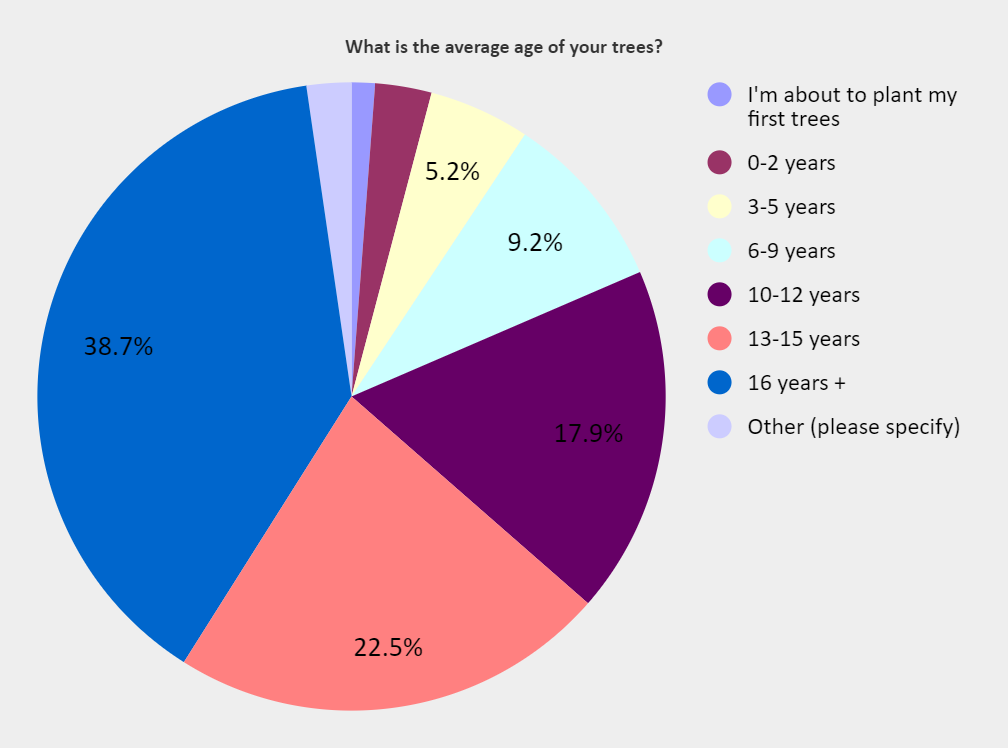
Average age of Australian Olive Trees
79% of respondents have had their trees planted for more than 10 years and over 38% for more than 16 years. Boundary Bend’s average tree age is 9.7 years.
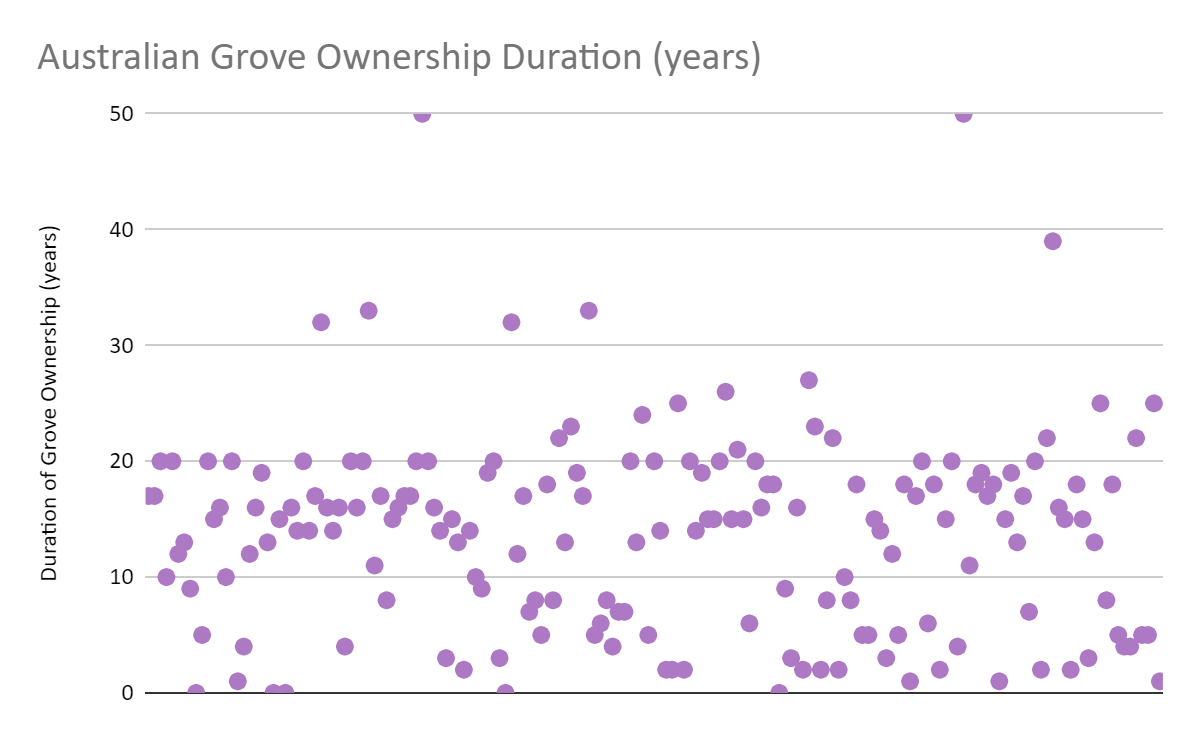
Olive Grove Ownership Duration
The average age of Olive Grove ownership is 13.78 years.
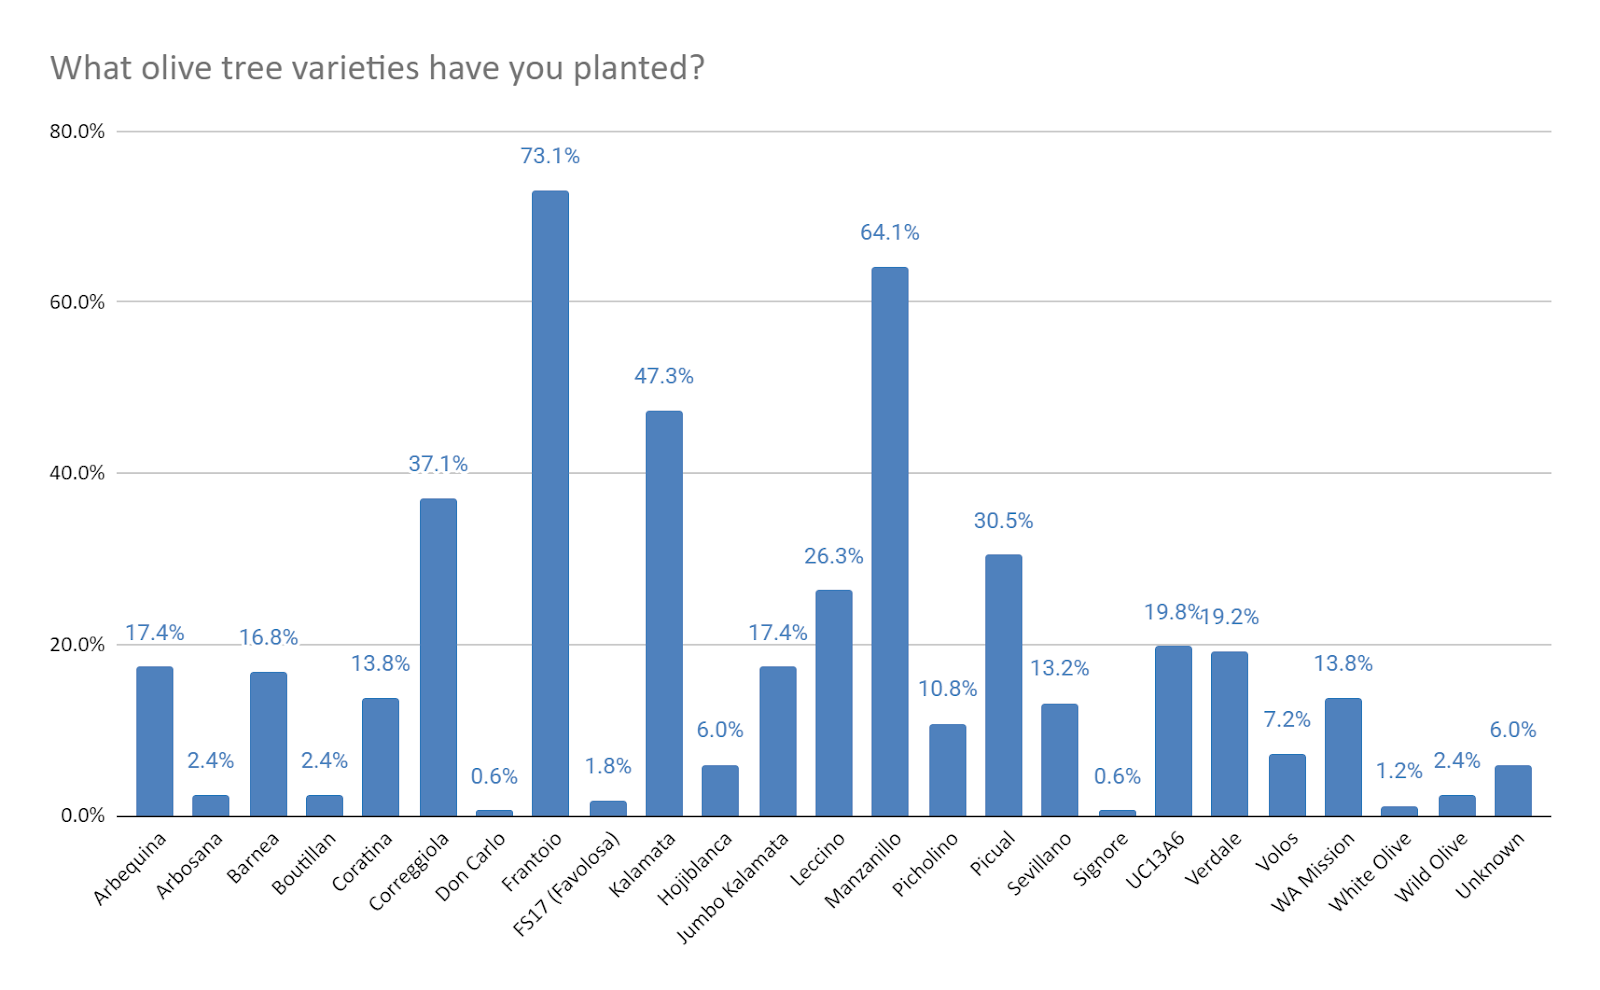
Varietals Planted in Australian Olive Groves
Frantoio and Manzanillo are the predominant varietals planted followed by Kalamata & Correggiola.
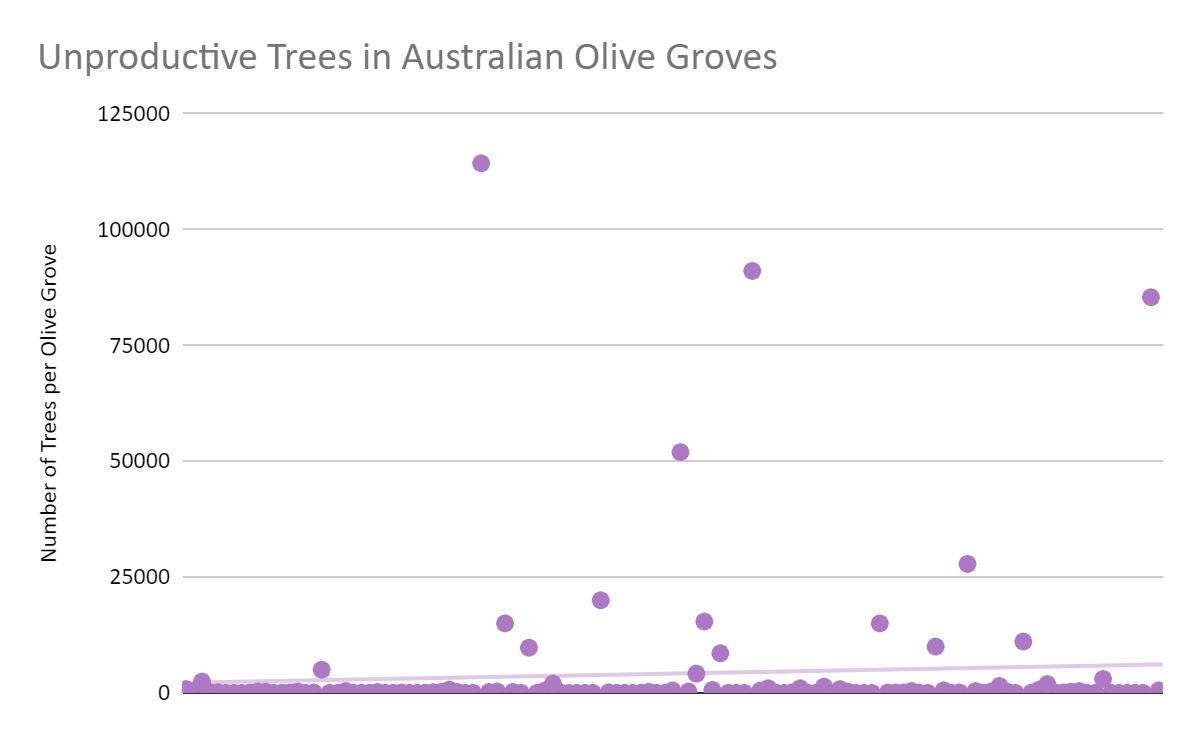
Unproductive Olive Trees
Over 512,000 olive trees are unproductive on Australian olive groves which is almost 5% of total plantings in Australia.
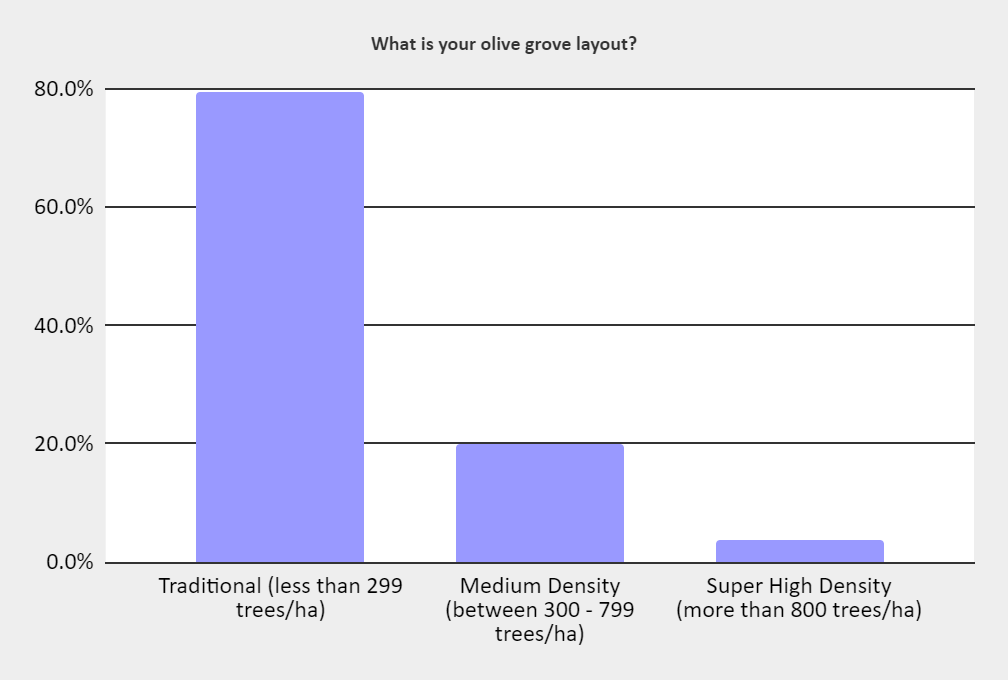
Australian Grove Layouts
Almost 80% of respondents have a traditional grove layout
0 thoughts on “Australian Olive Industry Survey: About The Australian Olive Grove ~ Part 3”